Nexla at NVIDIA GTC: Orchestrating Multi-Agent AI From Data to Production
At NVIDIA GTC 2026, Nexla and Nebius showcase a live multi-agent AI pipeline that turns video input into structured travel itineraries using scalable AI infrastructure.


With almost any data flow, monitoring is a critical piece to ensure records are flowing without error. Setting up a data flow is only the first step – from there, powerful and useful monitoring ensures the flow is still moving and makes triaging errors much easier. Nexla’s new Monitoring Connector now makes it easier than ever to fetch monitoring metrics on any source, flow, or individual data product in Nexla.
Nexla’s Monitoring Connector is now available to fetch rich monitoring metrics from any resource in Nexla. Simply point the connector to the ID of the resource, then use Nexla’s own tools to transform and send that dataset to the destination of your choice. Whether that’s an enterprise monitoring tool like DataDog or PagerDuty for error alerting, a real-time dashboard like Tableau or Looker to visualize data flows, or as a developer resource in a database or table, Nexla’s universal connectors make it easy to utilize that monitoring data. Fetching this monitoring data is straightforward with Nexla’s Monitoring Connector.
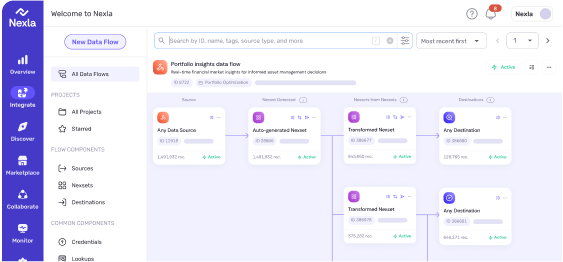
First, grab the ID of the resource you want to monitor. In Nexla, each source, dataset, and destination has a unique ID and all of these can be monitored. In the example below, to monitor the data flowing out of a Snowflake database I’ll use ID 11906.

Create a new flow in Nexla and select the Monitoring Connector source.

Set the connector to either Flow Metrics or Active Resource Performance mode, and input the resource ID. Click Test and instantly get a preview of the monitoring data you’re fetching. Set how often you want the connector to fetch metrics on your resource (daily, weekly, hourly) and you’re done.

Now that your source has been added, work with the data product by transforming as necessary, or send it right to any destination you need.

Nexla’s new Monitoring Connector makes it easier than ever to monitor and get important flow, dataset, and destination metrics where you need them. Whether you’re a developer triaging errors and debugging a flow or an analyst making sure all of your data flowed to the right place, the Monitoring Connector makes it easy to fetch those metrics in real-time and check flows at a glance. For any data flow, from anywhere to anywhere, just drop in the resource ID and you can get monitoring metrics right away.
Want to try it out yourself? Get a personalized demo and free trial today.

At NVIDIA GTC 2026, Nexla and Nebius showcase a live multi-agent AI pipeline that turns video input into structured travel itineraries using scalable AI infrastructure.

Explore how a multimodal AI pipeline built with NVIDIA models, Nebius infrastructure, and Nexla orchestration converts social media travel videos into structured itineraries.

In episode eight of DatAInnovators & Builders Podcast, Michael Domanic, VP at UserTesting, explains how enterprises run AI teams of three to drive transformation.
