Being able to monitor, audit, and oversee data at every stage is essential for minimizing data cost while maximizing data value. Configuring flows to automatically retry on failure, quarantine bad records, and notify the right people the moment something goes wrong is a foundational part of modern data governance. This article walks through how Nexla makes that practical at production scale.
Core Components
There are three pillars to making error reporting easy to manage, even for the largest enterprise deployments:
Global notifications and monitoring
Flow-level errors and notifications
Validation rules and filters
Let’s take a closer look at each.
1. Global notifications and monitoring
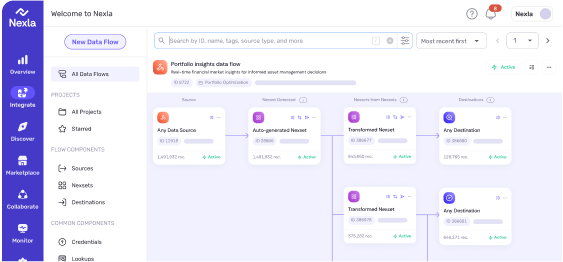
Seeing errors at a glance is the foundation of error reporting. The Nexla Overview dashboard surfaces your connected Data Sources, Data Destinations, Nexsets, recent Flow Runs, account usage (number of records and data volume across a chosen date range), and a live Notifications panel that includes any active errors and the overall health of your data flows. Account-wide resource counts, recent activity, and the most pressing alerts are all visible without leaving the home screen.
From this view, you can click into any Source, Destination, Nexset, or Flow to investigate specific failures. Global delivery preferences for alerts are configured under Monitor → Notification Settings, where every notification can be routed to four channels: App, Email, Slack, and Webhook. Webhook delivery is set up by creating an Incoming WebHook URL, after which Nexla posts events to that endpoint. Settings are organized across three tabs so you can independently tune the volume of each kind of signal:
Platform Activity (collaboration and resource lifecycle): Dataset Shared, Invitee Accepted, New Derived Dataset, Resource Activated, Resource Paused, Resource Deleted, Resource ACL Changed, and Approval Request Notifications.
System Alerts (catalog and schema): New Dataset Detected, New Dataset Write, Schema Change, and Catalog Dataset Error.
Data Alerts (operational data quality and movement): Source Data Volume Change, Source Data Delayed, Source Data Read Error, Destination Data Write Error, Dataset Transform Error, Destination Transform Error, Source Empty File, Source and Destination Read/Write Started/Done events, Custom Flow variants of the same, and Flow Orchestration Failures.
Because notifications can be delivered via webhook, they integrate cleanly with enterprise observability stacks like Datadog and PagerDuty. Point a webhook at your incident-management endpoint and Nexla error events become first-class signals in the same systems your on-call teams already watch, alongside platform and infrastructure alerts.
With everything visible from one screen and auto-notifications wired to the channels your team already uses, error response gets faster and downtime shrinks.
2. Flow-level errors and notifications
Errors can also be inspected inside specific flows and individual Nexsets. Click into any Flow to see exactly where an error is occurring, for example an ingestion failure on a Source, a transform-time issue on a Nexset or a Reusable Transform, or a delivery failure on a Destination. Monitor → Notifications shows the global error stream, with each entry linking back to the affected resource and offering a one-click Flow Insights view for deeper context.
In the example shown above, a Source is failing to ingest data and the Notifications panel surfaces the precise message (“FATAL: password authentication failed for user ‘postgres'”) along with the affected Source name and its ID. Whether the underlying cause is a credential issue, a temporary outage, a server drop, or a schema problem, it is captured and documented. Error messages can be exported in bulk for triage. For destination-side failures, Nexla also makes its retry intent explicit in the notification itself, for example: “We will continue attempting to write data out to this destination and quarantine any erroneous records.”
For transient disruptions, Nexla automatically retries. Records that still fail are quarantined without halting the rest of the flow, and the failure reason is attached to each record. As Nexla’s own product copy puts it, “Nexla detects errors during different stages of data flow such as ingestion, transformation, and output. Error records are quarantined and accessible to the user via APIs as well as files.” Two purpose-built investigation surfaces help you act on that quickly:
Monitor → Resource Triage lets you select a Resource Type and Resource ID to view that resource’s event timeline and assess issue severity.
Monitor → Error Data lets you select a Resource Type (Nexset, Destination, Source, or Reusable Transform) and Resource ID and view every record that failed during Flow execution, so you can analyze, replay, or export them.
Under Monitor → Error Data Settings, you can configure Nexla to automatically write all error records to a destination of your choice (such as cloud object storage), with metadata categorizing each failure. Monitor → Data Flow Status complements this with at-a-glance filters for Flows with errors, Flows with warnings, and flows running cleanly, so triage starts where the problems actually are.
Being able to diagnose what is failing, where, and why, quickly and precisely, is critical when you are operating on billions or trillions of records.
3. Validation rules and filters
Validation is a core part of data monitoring, and Nexla makes it straightforward to enforce per-field rules on any Nexset.
Open the Flow, go to the Transform screen, and select the attributes you want to validate. For example, suppose email is a required field. You can mark it as required, then add a secondary validation to ensure the value matches an email pattern. You can also constrain id to be a positive number. Once the rules are saved, Nexla continuously evaluates incoming records and routes anything that fails into error data, while triggering whatever notifications you have configured (typically the Dataset Transform Error or Destination Transform Error data alerts).
When a validation error occurs, it shows up on the Flow, and the Error Data view lists each failed record along with the reason it failed. From there, you can configure an automatic export of error records to a destination of your choice, useful for downstream remediation, audit trails, or feeding data-quality dashboards. Combined with Trace Record Lineage, you can follow a single record from where it entered the platform to where it failed, which is invaluable when reproducing or explaining an incident.
With automatic notifications, structured error data, and easy reporting, Nexla turns error management into a fast, repeatable workflow rather than a fire drill.
Conclusion
Keeping data flows healthy and accurate is essential to data governance. Global notifications across App, Email, Slack, and Webhook prevent downtime; field-level validation raises the quality of every record that reaches your warehouse, lakehouse, or AI pipeline; and Error Data plus auto-retry and quarantine make recovery routine. Resource Triage, Data Flow Status, and Trace Record Lineage round out the picture by giving operators fast paths from “something is wrong” to “here is the exact record, resource, and reason.”
If you’re ready to put thorough governance and error reporting in place as part of a unified, modern data platform, get a demo or book a free data mesh consultation today and see how much more your data can do when everyone in your organization can use it securely. For more, explore the rest of Nexla’s blog.
MCP Security That Uses Your Identity, Your Credentials, and Your Policies
As AI agents reach into enterprise systems, the question is not whether they can connect, but whether they do it without bypassing your security controls. Here is how Nexla keeps MCP access tied to each user’s identity and credentials, and lets your systems keep enforcing their own policies.
MCP Tool Bench is a controlled way to benchmark MCP server design. We put Nexla’s task-specific MCP servers against off-the-shelf ones on real BigQuery tasks, in two harnesses, and measured the agent effort each demanded.